Summary Dashboard
The Summary Dashboard is the fastest way to answer, “Where is my portfolio exposed right now?” It groups your current positions into practical views and lets you jump into the underlying holdings when something needs attention.
Open it from the sidebar:
Summary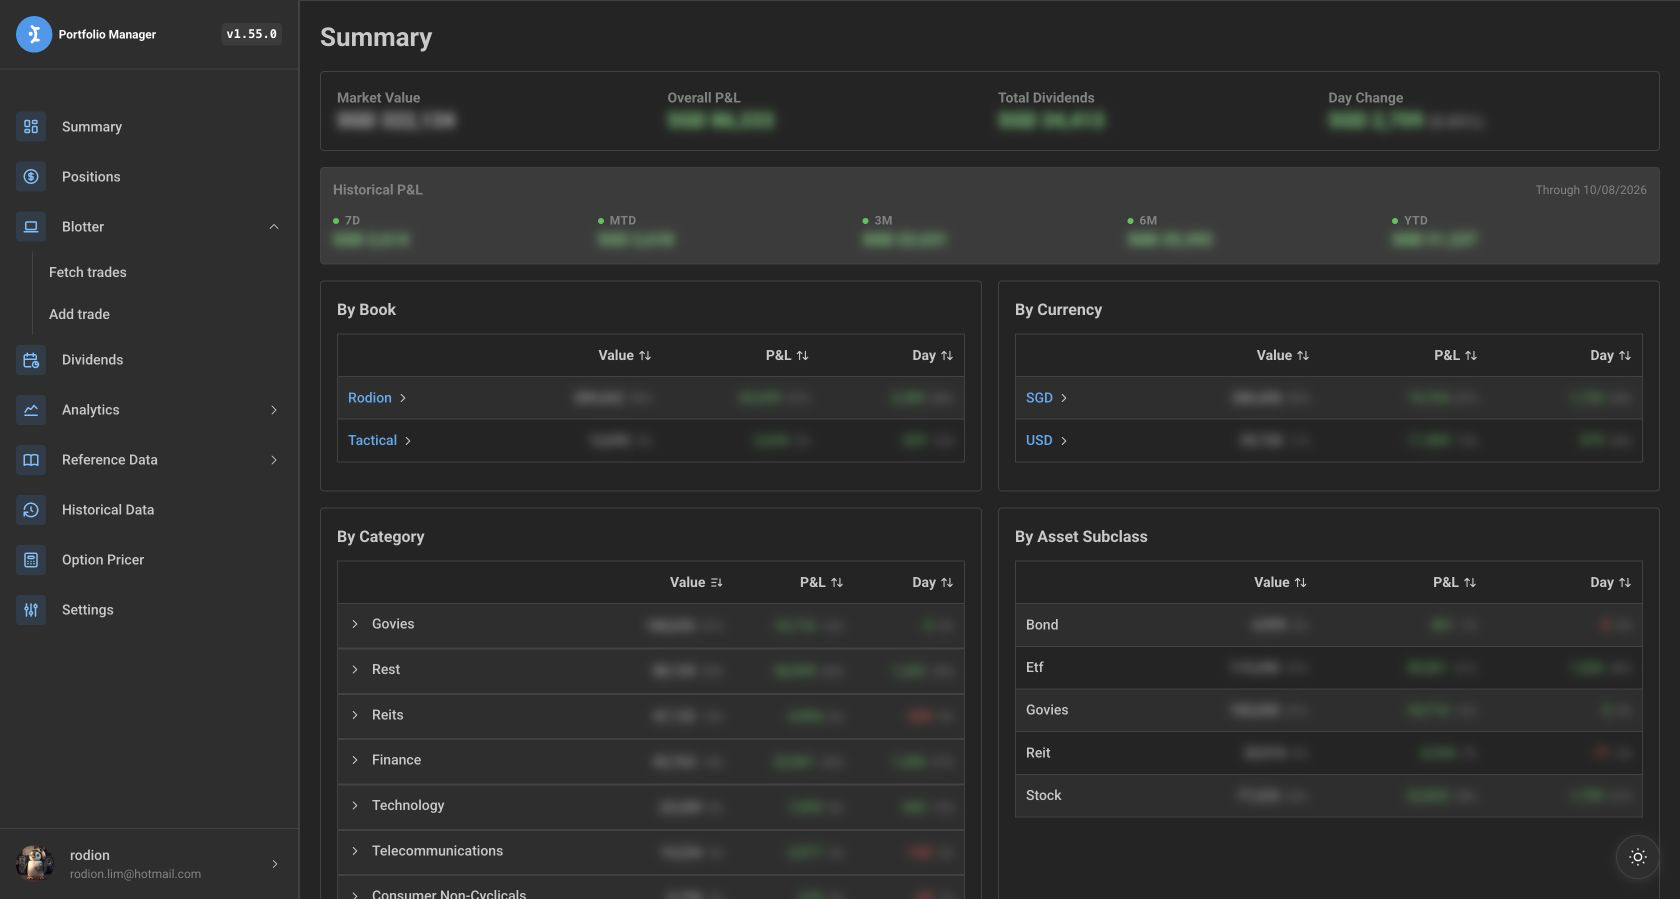
The screenshots on this page blur portfolio figures for privacy.
What It Shows
Section titled “What It Shows”At the top, Portfolio Manager shows portfolio-level totals in your base currency:
| Metric | What it means | Example |
|---|---|---|
| Market Value | Current total value after FX conversion | SGD 482,400 |
| Overall P&L | Total unrealized profit or loss after FX conversion | SGD 38,250 |
| Total Dividends | Cumulative dividends recorded in the latest portfolio metrics | SGD 12,600 |
| Day Change | Change from cached previous prices, when available | SGD -1,280 (-0.27%) |
Day Change appears only when cached historical prices are available for your current tickers.
Historical P&L
Section titled “Historical P&L”The Historical P&L strip compares the latest portfolio P&L with the most recent snapshot at or before each period boundary:
| Period | Meaning |
|---|---|
| WTD | Change since Monday, the start of the current week |
| MTD | Change since the start of the current month |
| QTD | Change since the start of the current calendar quarter |
| YTD | Change since the start of the current calendar year |
A period displays Insufficient history when there is no suitable baseline snapshot. The date at the top right shows the latest historical metric used by the strip.
Allocation Tables
Section titled “Allocation Tables”The dashboard then breaks the portfolio into four tables:
| Table | Use it to answer |
|---|---|
| By Book | Which strategy, account, or portfolio sleeve holds the value? |
| By Currency | How much exposure sits in each trading currency? |
| By Category | Which sectors or categories dominate the portfolio? |
| By Asset Subclass | How much is in stocks, ETFs, govies, cash-like assets, or other subclasses? |
Each row shows value and P&L. When day-change data is available, rows also show the day’s movement. Percentages beside amounts show each row’s share of that table’s total.
Example With Mock Data
Section titled “Example With Mock Data”This example is illustrative. Your dashboard is calculated from your imported trades, position prices, FX rates, and reference data.
| Group | Value | P&L | Day |
|---|---|---|---|
| Core book | 320,400 |
28,200 |
-860 |
| Income book | 112,000 |
7,100 |
140 |
| Trading book | 50,000 |
-1,050 |
-560 |
For category review, expand a row to see the tickers that make up the total:
| Category | Ticker | Name | Value | P&L | Qty | Dividends | Current price |
|---|---|---|---|---|---|---|---|
| Technology | AAPL |
Apple | 82,400 |
12,300 |
300 |
820 |
275.33 |
| Technology | MSFT |
Microsoft | 96,500 |
9,300 |
190 |
570 |
507.89 |
| Govies | BS23124S |
Singapore T-bill | 96,200 |
2,400 |
Useful Actions
Section titled “Useful Actions”- Click a Book row to open Positions filtered to that book.
- Expand a Category row to inspect the tickers contributing to that category.
- Use the pencil action in expanded category details to update missing or incorrect reference data.
- Sort Value, P&L, or Day columns when you want to find the largest exposure or biggest mover quickly.
Portfolio Activity
Section titled “Portfolio Activity”Below the allocation tables, Portfolio Activity combines historical performance with aggregated trades. Use the toggle to switch between:
- Monthly: the current month and previous 23 calendar months.
- Yearly: the current calendar year to date and the previous calendar year.
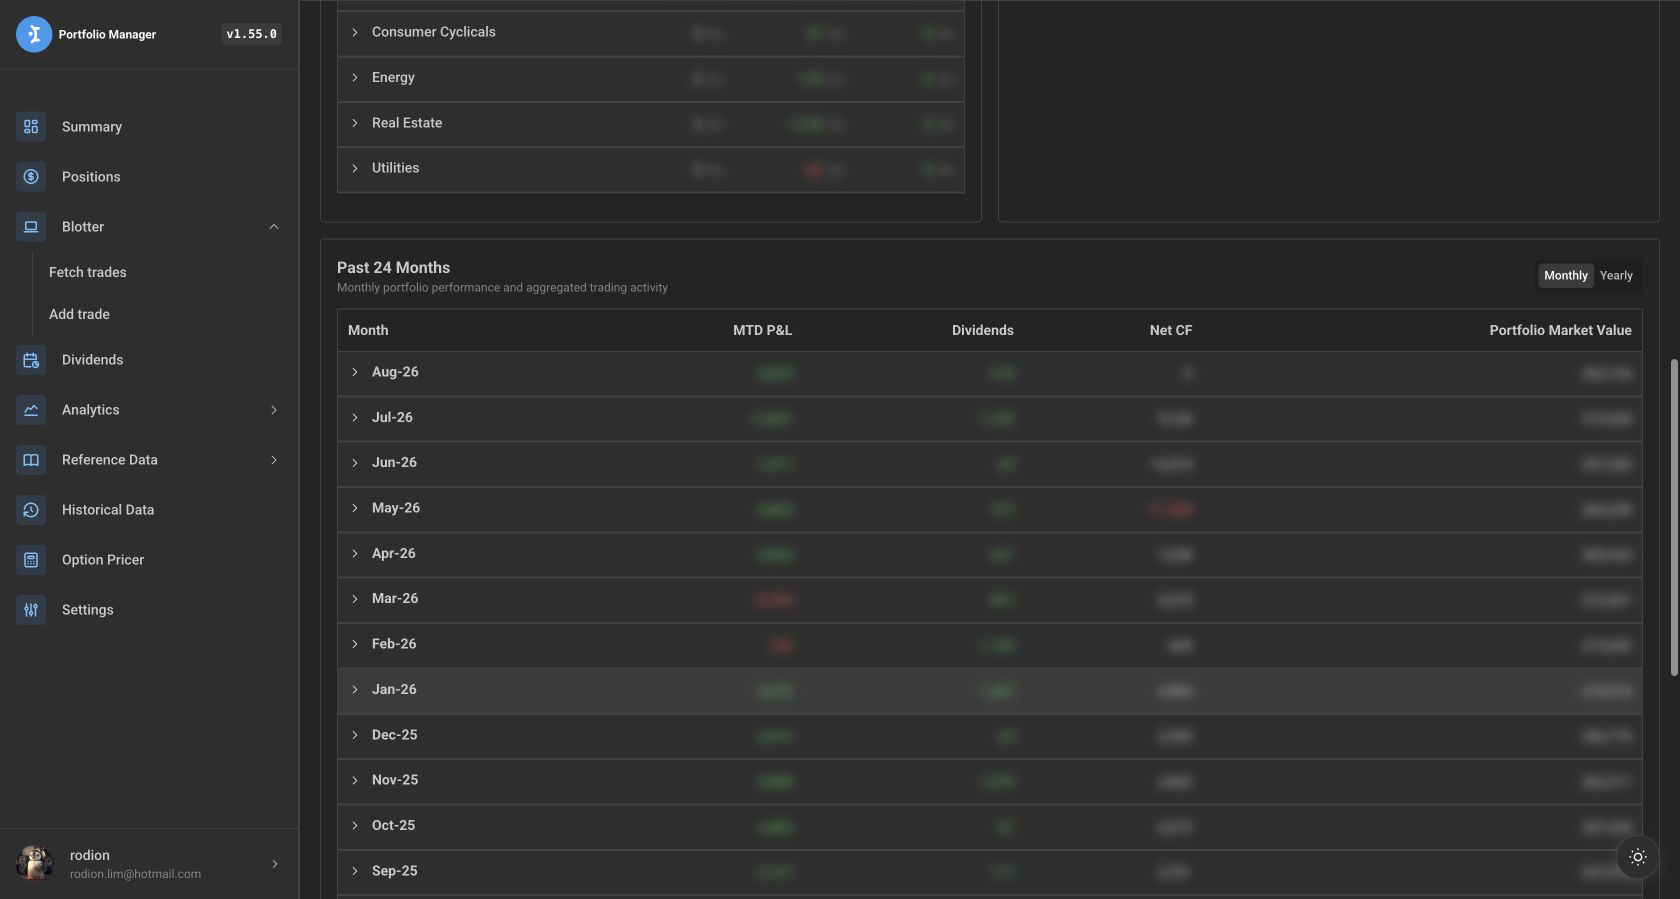
Each row shows period P&L, dividends received during the period, net cash flow, and ending portfolio market value. Expand a row to see trades grouped by ticker, including bought and sold quantities, average transaction price, and net price paid.
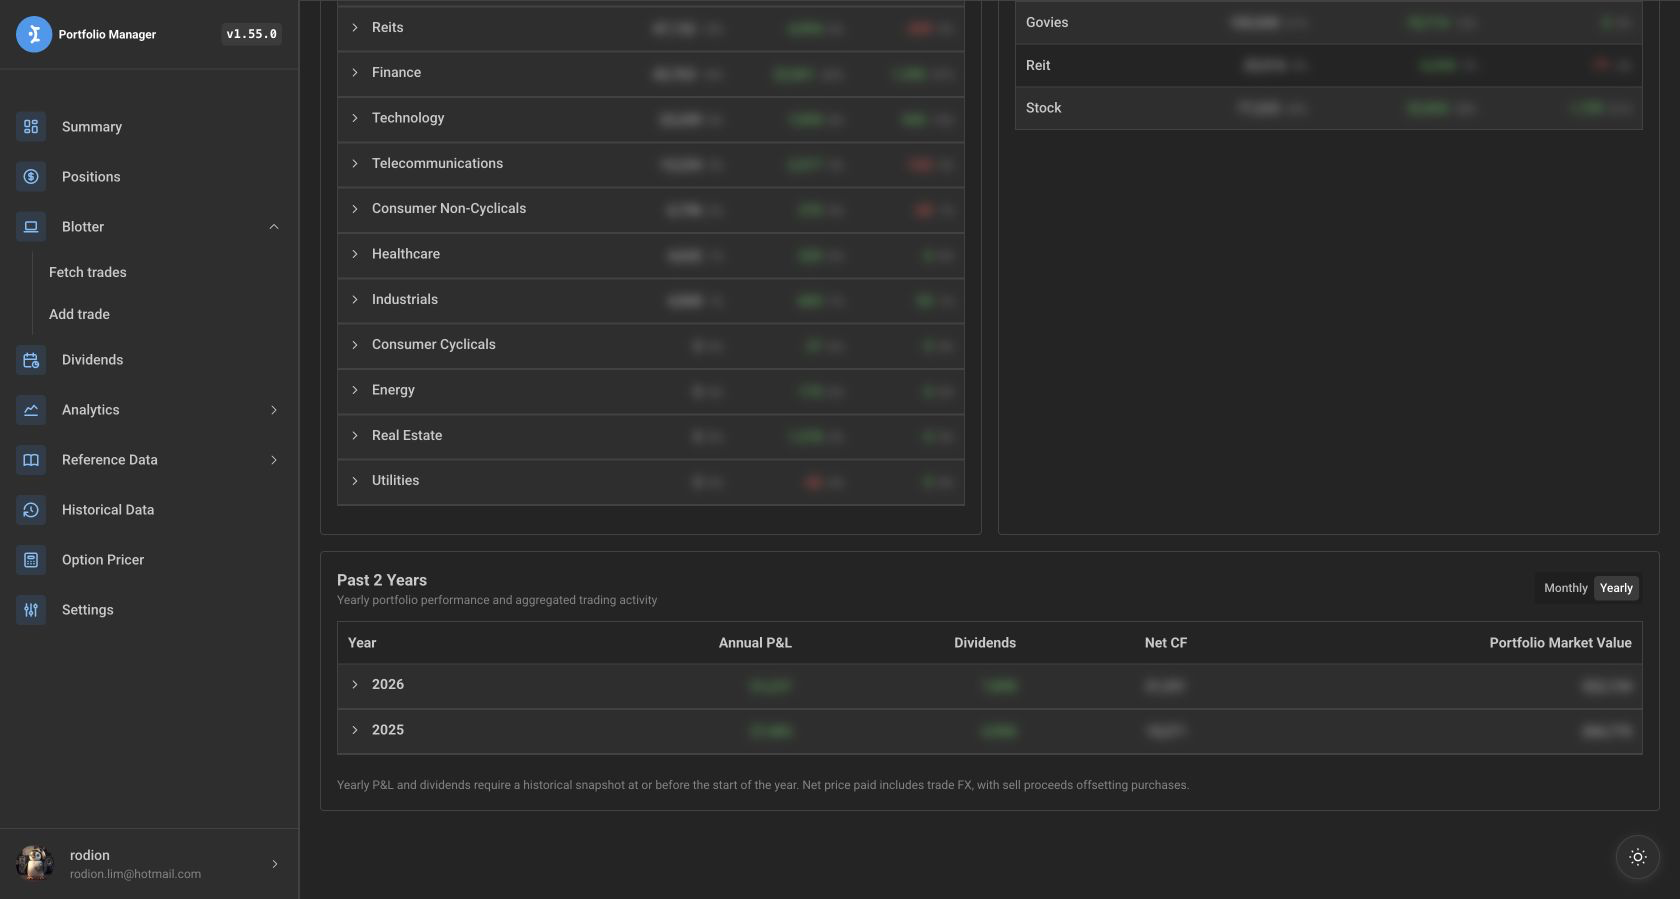
Period P&L and dividends require a historical snapshot at or before the period start. Net cash flow includes trade FX, with sell proceeds offsetting purchases.
Before You Rely on the Numbers
Section titled “Before You Rely on the Numbers”Check these inputs when a number looks wrong:
- Positions come from your imported or manually entered blotter trades.
- Currency conversion uses each position’s FX rate.
- Category and asset subclass come from reference data, with Singapore government securities grouped as Govies.
- Day Change needs cached previous prices. If it is missing, run or schedule historical price collection.
- Historical and activity comparisons need snapshots that cover the requested period boundaries.
Related Screens
Section titled “Related Screens”Use Positions when you need the line-by-line holdings behind the summary:

Use Dividends when you want income detail instead of allocation detail: